
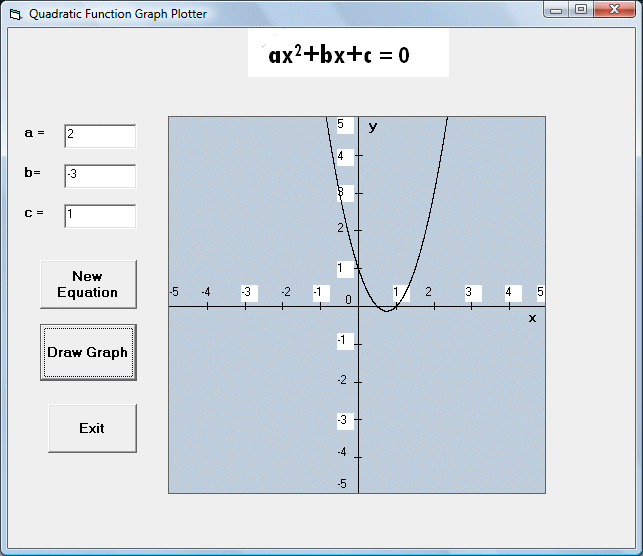
This is a program that can plot graphs for quadratic functions. The formula of a quadratic equation is f(x)= ax2+bx+c , where a, b and c are constant.
This program
employs a picture box as the plot area and three text boxes to obtain
the values of the coefficients a, b, c of the quadratic equation from
the users. We also need to modify the scale factor in the properties
windows of the picture box. We are using a scale of 0.5 cm to represent 1
unit .
Besides, we need to make some transformation as the coordinates in VB start from top left
but we want it to start from the middle. We can use the Pset method to
draw the graph using a very small increment. Pset is a method that draws a dot on the screen, the syntax is
Pset(x,y), color
Where (x,y) is the coordinates of the dot and color is the color of the dot. Using the For Next loop together with Pset, we can draw a line on the screen.
Private Sub cmd_draw_Click()
Dim a, b, c As Integer
Dim w, v As Single
a = Val(txt_a.Text)
b = Val(txt_b.Text)
c = Val(txt_c.Text)
'Using a scale of 0.5 cm to represent i unit to draw the graph
' Need to make some transformation as the coordinates in VB start from top left
For w = 0 To 10 Step 0.001
v = a * (5 - w) ^ 2 - b * (5 - w) + c
pic_graph.PSet (w, 5 - v)
Next w
End Sub
Private Sub Command1_Click()
pic_graph.Cls
txt_a.Text = ""
txt_b.Text = ""
txt_c.Text = ""
End Sub
Copyright©2008 Dr.Liew Voon Kiong. All rights reserved |Contact|Privacy Policy